
The Résumé, Measured


The Résumé, Measured
Greg Sankey and Lane Kiffin say the SEC's schedule earns it playoff spots the record alone won't show. We built a way to check — from the one number that has no conference loyalty: the closing point spread.
Dave Bartoo - Co-Founder Matrix Analytical Data Team | Five seasons, 2021–2025 |
Market-derived résumé ratings
The argument never really ends. An SEC coach says a nine-win team in his league is better than an eleven-win team somewhere softer. A Big Ten fan says wins are wins. Everyone points at "strength of schedule," and everyone means something slightly different by it. The debate runs on adjectives.
We wanted to run it on numbers instead — but not the usual ones. Poll votes are opinion. Computer rankings each have a house style, and they disagree with each other by dozens of spots on the same team. So we went to the one estimate of team strength that is scrutinized by people with money on the line, updated on every team, and tied together across every game in the country: the closing point spread.
Betting markets aren't magic, but they have one property no ranking model does — they have no reason to love or hate a conference. A line that misjudges the SEC is a line that loses money. That single property is what lets a spread-based measure settle a conference argument without simply assuming the answer.
And there's a bigger question underneath the shouting. Everyone in this argument — Sankey, Kiffin, the fan whose team just missed — agrees something hurts. Where they split is the treatment. The loudest answer, the one gathering momentum, is expand: more teams, more access, fewer teams left home to complain. So before we get to who's right about the SEC, hold one question in mind, because everything below is really about it: is expansion a cure, or just a painkiller that leaves the actual problem in place?
=====================================================================
01 / THE TWO NUMBERS EVERYONE CONFUSES
Strength of schedule is not a résumé
When fans argue résumés — "they beat who they were supposed to, they have no bad losses, they earned it" — they are describing a specific thing, and it already has a name. It just isn't strength of schedule.
Strength of Schedule (SOS) asks one question: how hard was your slate? It says nothing about how you did against it. Strength of Record (SOR) asks the question that actually decides playoff arguments: given that schedule, how impressive is your record? Formally, it's the chance an average top-25 team would match your results against your opponents. That is the résumé. SOS is only one ingredient inside it.

FIGURE 1 · MEASUREMENT PRECISION
How sure can you be of the rank? SOS is blurry; SOR is sharp.
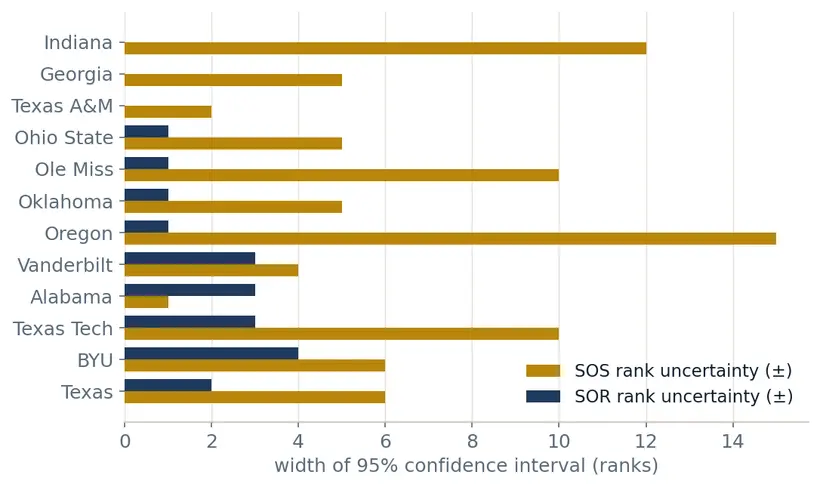
95% confidence intervals on each rank, from resampling the 2025 season. A wide bar means the metric can't really tell you where the team belongs. Median SOS interval spans 12 ranks; SOR spans 5. When a number can't distinguish 15th from 40th, you can't build a selection case on it.
This is the quiet problem with SOS as a committee tool. There are only about thirteen games per team, and the cross-conference games that connect one league's difficulty to another's are barely a third of them. That thin web is all any system has to rank 136 schedules against each other — so the honest error bars are enormous. The metric is fine for coarse claims and useless for the fine ones every selection argument turns on.
FIGURE 2 · DOES THE METRIC FIND THE FIELD?
SOR reproduces the playoff field. SOS barely tries.

Share of the actual playoff field (and the committee's final top-12) recovered by each metric, 2021–2025. SOR lands 83–87%. SOS lands 17% — not because it's broken, but because it was never a measure of teams. It measures opponents.
02 / THE COMMISSIONER'S CLAIM
Sankey is right about the schedule
Start with the part that holds up. SEC commissioner Greg Sankey has argued the conference plays the sport's hardest schedules and that the difference is real and growing. On the market data, that's simply true.
FIGURE 3 · SCHEDULE DIFFICULTY BY LEAGUE
The SEC's edge is real — and, according to closing spreads, it widened across these four years

Average schedule difficulty (expected losses a top-25 team would take on each league's slate). The SEC leads four of five seasons; the gap over the next-toughest league grew from a dead heat in 2021 to a full expected loss by 2025. Derived from closing lines — no conference prior, no preseason projection. (A description of what happened, not a forecast.)
Two things make this sturdy. It comes from betting markets, so it can't be dismissed as an ESPN FPI SEC-friendly model — we tested for conference bias directly and found none. And it measures games actually played, not a preseason guess. That last point matters: the specific statistic Sankey reached for in 2026 — 14 of the top 15 schedules — was a subjective ESPN FPI preseason projection. He didn't need it; the measured version of his claim is stronger, and it's his to keep.
But being right about the schedule is not the same as being right about what to do with it — and this is where Sankey's argument goes wrong. He cited the least reliable version of the weakest metric, and he's asking that metric to do a job it shouldn't. We settle accounts with him in the verdicts. For now, hold the fact and watch the conclusion fail to follow from it.
03 / THE EXCHANGE RATE
What a hard schedule is actually worth
Granting that SEC schedules are hardest, the question becomes: how much is that worth in the currency that decides playoff spots — losses? Across 334 power-conference team-seasons, we measured how much extra schedule strength it takes to offset one additional defeat.

So the SEC's schedule advantage is real, but worth a little over half a win. That justifies weighting an SEC record more heavily than an equal record elsewhere. It is not enough to erase a whole extra loss — let alone the two-loss gap in Lane Kiffin's "9–3 is better than 11–1" framing.
04 / THE KIFFIN TEST
9–3 in the SEC vs. 11–1 anywhere else
Lane Kiffin's proposition is specific: the committee should be able to look at a 9–3 SEC team and call it better than an 11–1 team from another conference. He even named the matchup — his own league's 2025 season, 9–3 Texas against 11–1 Oregon. So start exactly where he pointed.
FIGURE 4 · TEXAS (9–3, SEC) VS. OREGON (11–1, BIG TEN), 2025
The example Kiffin chose — and it doesn't hold

Ranks (lower is better) with intervals on SOR. Texas played the far tougher schedule (9th vs 42nd). But by the closing line methodology we used, Oregon's résumé is cleanly better — the intervals don't overlap — and on team quality the two are a near-tie in Oregon's favor. On the matchup Kiffin actually cited, his argument fails on both measures.
Texas/Oregon doesn't work. Widen it to every comparison of its kind from 2021–2025 and the résumé verdict is unanimous: the 11–1 team wins every pairing. But here's what makes Kiffin half-right rather than wrong: he picked the wrong year. Change the question from résumé to quality — who's the better team — and look at 2024.
FIGURE 5 · THE CASE KIFFIN SHOULD HAVE MADE — 2024
Alabama and Ole Miss were better teams than Indiana

On team quality, 9–3 Alabama (5th) and Ole Miss (6th) rated well above 11–1 Indiana (17th), which made the field. On résumé, Indiana still beat them — so the committee's call was defensible. But Kiffin's underlying instinct, that a great team can hide behind an SEC record, is real here. He argued it with the wrong example.
So Kiffin is wrong that a 9–3 SEC team out-résumés an 11–1 team — it hasn't happened once in five years — and wrong on the Texas–Oregon example. But he's right that a 9–3 SEC team can be a better team than one that got in. The committee, which selects on résumé, correctly took Indiana. Kiffin, talking about quality, has a real point about Alabama and Ole Miss. They're answering different questions.
05 / THE SNUB CUTS EVERY WAY
This was never only an SEC problem
Here's what gets lost when the debate is framed as SEC-versus-everyone: the teams with legitimate grievances aren't all wearing SEC colors. In both 2024 and 2025, the loudest snubs were as much Big 12, ACC, and independent as they were SEC.
FIGURE 6 · LEFT OUT, BUT HAD A CASE
The snubs span every power conference

Teams left out that ranked inside the top-13 by résumé or top-12 by quality. 2024: South Carolina, Alabama, Ole Miss (SEC) and Miami (ACC). 2025: Vanderbilt, Texas (SEC), BYU (Big 12), and Notre Dame — 2nd nationally in quality — which still missed. [Color = conference].
Look at 2025. Notre Dame was the 2nd-best team in the country by quality and didn't make the field. BYU went 11–2 with the 11th-best résumé. Those are a Big 12 grievance and an independent one, every bit as legitimate as Texas's. Meanwhile the team that took a disputed spot, Tulane, ranked 23rd by résumé — an automatic Group of Five bid.
The point isn't that the committee blundered. It's that there is always someone with a case with the current format and ranking rules. Four teams, eight, twelve, twenty-four — expand the field however you like, and a very good team will still sit just outside it with a real argument. That's not a flaw to engineer away; it's the permanent condition of a bracket with a boundary. The real question isn't how to end the arguments — you can't — but which arguments are worth having. An 11th-best team missing is a good argument. A 40th-best team getting an automatic bid is not.
06 / NEITHER NUMBER IS EVERYTHING
The metrics inform. They don't decide.
We've spent five sections arguing SOR is the right measure and SOS the wrong one. Now the honest counterweight: no résumé metric captures everything, and the last two title games prove it.
FIGURE 7 · WHEN THE METRIC DIDN'T SEE IT COMING
The last two championship games were played by teams the numbers underrated

Selection-day ranks vs. what happened. Ohio State won the 2024 title as the 8-seed — 1st in quality, 9th in résumé. Notre Dame reached that final ranked 5th in résumé, 11th in quality, on the 57th schedule. Miami reached the 2025 final ranked 14th in résumé and 10th in quality. None of these runs was written in the numbers.
Miami is the cleanest example. Our SOR put the Hurricanes 14th and quality 10th — outside the résumé elite by both measures. Then they reached the national championship game. A résumé describes what a team has done; it cannot fully measure what a team is, or what it becomes in January when rosters are healthy and the stakes reset.
This is the guardrail on everything else here. SOR is the best tool for the selection question — who earned it — and the committee should lean on it. But selection isn't prediction, and the committee is right to leave room for judgment the numbers can't supply. When it took quality-driven flyers — an Ohio State that underachieved its résumé, a Miami whose ceiling outran its record — it was often rewarded. The metrics should inform the committee. They were never meant to replace it.
07 / THE REAL CULPRIT
It isn't the committee. It's the auto-bid.
So if the committee selects well on résumé, and good teams still get left out every year, where's the structural problem? Not in its judgment — in the slots it never gets to decide. Strip out the Group of Five auto-bids and the weakest at-large picks, fill all twelve with the best Power-4 résumés, and watch what happens:

In three of four years, at least one 9–3 SEC team clears an all-Power-4 bar it missed in the real, auto-bid-diluted field. And it isn't only SEC teams — the same exercise pulls in BYU and Notre Dame, whose spots also went to lower-résumé automatic qualifiers.
So the deserving teams — SEC and otherwise — weren't beaten by better résumés. They were beaten by automatic ones. The guaranteed Group of Five bid consumes slots that on merit belong to teams ranked eight or ten spots higher. The committee didn't undervalue anyone. The format tied its hands.
And there's the answer to the question we opened with — it's been sitting in the data the whole time. The thing everyone feels every December, the deserving team left home, isn't caused by the field being too small. It's caused by slots being given away. Expanding the field doesn't touch that; it just adds more slots around the same broken ones and moves the complaint down a row. The snub everyone points to is the symptom. The automatic bid is the cause. Treat the cause and you don't need more teams. Add more teams and you've treated nothing — you've only made the field bigger and the argument quieter for a year or two, until it comes back with a larger number attached.
08 / WHY THE FIX IS STRUCTURAL
The Group of Five is falling off the pace
There's a reason the auto-bid has become the pressure point now: the gap has widened. In 2021, Cincinnati went undefeated and was, by quality, better than the 12th-best team in the country — a G5 team that earned its place with no asterisk. Across the four seasons since, the best the Group of Five can offer has fallen further below the playoff bar.
FIGURE 8 · THE GAP THAT OPENED
The best G5 team vs. the quality bar it must clear

Team-quality rating of the best Group of Five team each year, against the 12th-best rating nationally. Cincinnati cleared it in 2021. Over the four seasons since, the G5's best has sat below the line, and the distance has grown — to more than eleven points by 2025. This describes 2022–2025; it isn't a forecast, and a strong G5 team could close it again.
The likely mechanism isn't mysterious. NIL and the transfer portal concentrate talent, and the schools with the most resources — overwhelmingly SEC and Big Ten — pull it upward. Realignment promoted the Group of Five's best programs into power leagues. 2021 Cincinnati proves a merit path can work; the four years since show it has narrowed to a thread. That argues not for punishing the Group of Five, and not for a rigid ranking cutoff either — but simply for ending the guarantee. Fold the fifth bid into the committee's ordinary judgment, the same discretion that governs every other pick. A Cincinnati still gets in, because the committee would rank an undefeated top-five-quality team without hesitation. A team the numbers rank 20th doesn't, because nothing forces it in over nine better ones from every conference.
09 / THE VERDICTS
Everyone gets something. Everyone gives something.
Five seasons of market data, and the fairest reading gives every party its due and takes something from each:
GREG SANKEY — RIGHT FACT, WRONG PLAYBOOK
Four things, in order. He's right that the SEC plays the hardest schedules — we confirm it, no thumb on the scale. He's wrong to prove it with preseason strength of schedule, a projection of a metric our own data shows is unreliable even after the season and wildly off before it. He's wrong, too, about the job: strength of schedule isn't a résumé, and even measured perfectly it should stay the last tiebreaker between two equal teams, nothing more. And here's the irony — the tools that would actually help his conference are the ones he isn't championing. Had he used real modeling to establish SEC strength, then lobbied to weight résumé and team quality and to replace the automatic Group of Five bid with the highest-ranked team regardless of conference, he'd have a winning argument. Our own numbers show scrapping that auto-bid puts deserving 9–3 SEC teams back in the field on merit. Sankey is playing the wrong hand with a winning deck.
LANE KIFFIN — RIGHT AND WRONG
Wrong that a 9–3 SEC team out-résumés an 11–1 team — it hasn't happened once — and wrong on the Texas–Oregon example he chose. But right that a 9–3 SEC team can be a better team than one that made it: 2024 Alabama and Ole Miss were. He argued a real point with the wrong evidence.
SOR OVER SOS — BUT NEITHER IS EVERYTHING
SOR is the résumé, and the tool the committee should lean on; SOS is too imprecise to carry a selection argument. Yet the last two title games were played by teams both metrics underrated. The numbers inform the decision. They don't make it.
THE COMMITTEE — DOING ITS JOB WELL
It selects on résumé and reproduces ~83–87% of what a clean résumé model would pick. In five years, it hasn't made a truly indefensible call — its one real miss, leaving out 13–0 Florida State in 2023, was a defensible use of the protocol's injury clause that it arguably overweighted, and it's the exact miss a twelve-team field prevents. Its instinct to leave room for quality — the Ohio States and Miamis a formula would have missed — has been rewarded on the field. Its hands are tied not by its judgment but by the format around it.
THE FORMAT — TREAT THE CAUSE, NOT THE SYMPTOM
There is always one more team with a case — at 4, 8, 12, or 24. So expansion never ends the argument; it relocates it and thins the field on the way. Twelve is the sweet spot: every team in it has a real claim. Sixteen waters it down. Twenty-four is a participation trophy. The snub everyone points to is the symptom; the guaranteed Group of Five bid is the cause. The fix removes a rule rather than adding one — not a rigid formula that strips the committee's judgment, but the end of that guarantee, folding those spots into the same discretion that governs every other pick. Boise State, James Madison, and Tulane come out; a Cincinnati, which the committee would rank on merit, still gets in; the room for the next Miami stays open. Keep twelve. Make all twelve earned.
No format is perfect, and no metric is either. There will always be a very good team on the wrong side of the line, and a January run no résumé foresaw. But there's a difference between a problem you manage and a problem you refuse to name. Expansion is the easy answer — it costs no one a guaranteed bid, asks no one to give anything up, and buys a quiet year or two. It's also the wrong one, because it treats the symptom and leaves the cause untouched, which means the same fight returns on schedule with a bigger number attached.
The hard answer is the real one: keep the field at twelve and make all twelve earned — not eleven and a guarantee. Hard decisions cost something now. That's what makes them hard, and it's what makes them work. The argument was never SEC versus Big Ten, and it was never really about the number twelve. It was merit versus a guarantee — and merit should win.
Though one might ask whether a controversy that returns this reliably, every December, is one the sport has much incentive to ever actually end.
METHODS & CREDIT
Sharpening a proven spear
We want to be precise about what's original here, because overclaiming is how good work gets dismissed. Almost every component below is borrowed from people who established it first. What's new is the combination, and the validation.
The method, in plain terms
The data. Every rating starts from closing point spreads — the market's final, sharpest estimate of team strength. Using the spread as the standard against which predictions are judged is settled practice, going back to Harville (1980) and Stern (1991); it is the ground we build on, not our discovery.
The ratings. Each team gets a rating that moves week to week (a state-space model), with adaptation speed chosen by cross-validation, not by hand.
The three measures. SOS = expected losses a top-25 team takes on your schedule. SOR = probability a top-25 team matches your record on it — the résumé. This is ESPN Analytics' concept, not ours; our version is built from market prices and independently reproduces their central finding. Quality = your own rating.
The honesty checks. Every rank carries a 95% confidence interval. Schedule difficulty was split into offenses- vs defenses-faced using play-by-play drive data and cross-checked three independent ways — market ratings, drive efficiency, and an outside playcaller-grade model — which agree at 0.85–0.99. We verified the market carries no conference bias before trusting it to judge a conference argument.
Original to this work: deriving SOS/SOR/quality from betting-market spreads with a time-varying engine; quantifying the SEC's schedule edge in expected-loss units with confidence intervals across five seasons; establishing the market's lack of conference bias; the all-Power-4 counterfactual. Built on others: the closing line as gold-standard quality measure (market-efficiency literature); Strength of Record (ESPN Analytics); résumé ratings via maximum-likelihood over game odds (prior public models). We sharpened a proven spear; we didn't forge it.
MATRIX ANALYTICAL DATA TEAM - Dave Bartoo Co-Founder Contact jdbartoo@matrixanalytical.com text: 971.247.8419
Market-derived résumé ratings, built on closing point spreads · matrixanalytical.com
Method: time-varying ratings from closing spreads, smoothing by cross-validation; SOR via Poisson-binomial; 95% intervals by residual bootstrap. Résumé-strength concept: ESPN Analytics. Market-efficiency foundation: Harville (1980), Stern (1991). Full 2021–2025 rankings available as companion PDFs. Cutoff: regular season + conference championships, pre-playoff.


Comments